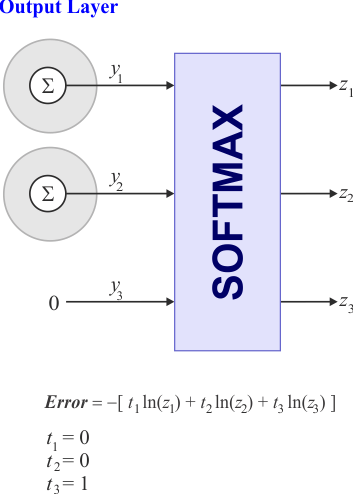
Cross Entropy |
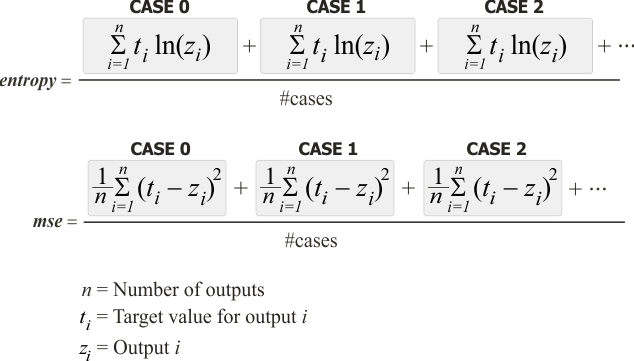
| In machine learning, cross entropy is used instead of the mean squared error to evaluate the performance of a classifier. The figure below shows the formula to compute the cross entropy and the mean squared error. En aprendizaje de máquina, la entropía cruzada es usada en lugar del error medio cuadrático para evaluar el desempeño de un clasificador. La figura de abajo muestra la fórmula para calcular la entropía cruzada y el error medio cuadrático. |
| Problem 1 |
| Search on the Internet about cross entropy. Then write a 100 words summary about cross entropy. Busque en la Internet la entropía cruzada. Entonces escriba un resumen de 100 palabras acerca de la entropía cruzada. |
| Problem 2 |
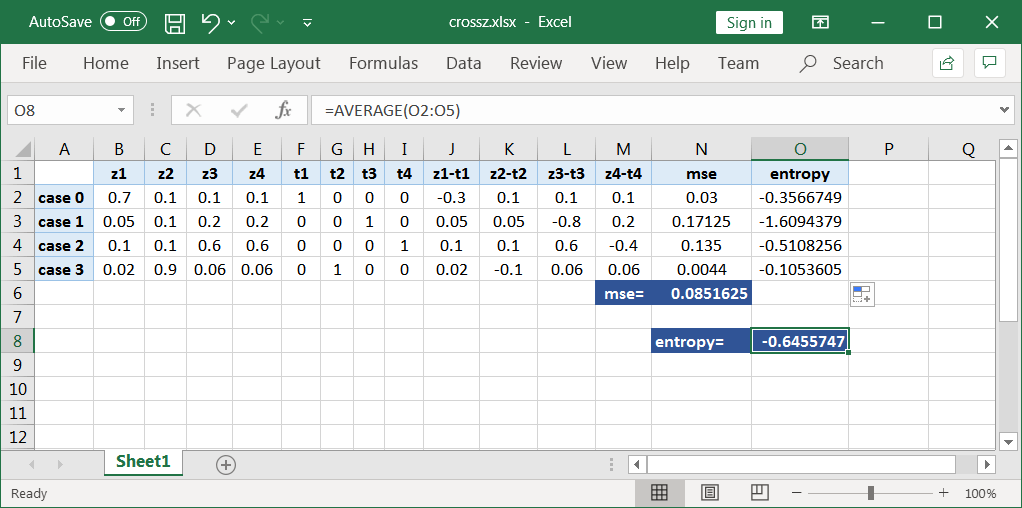
| Compute the mean squared error and the cross entropy of the network below using Microsoft Excel. The file name must be crossz.xlsx. Calcule el error medio cuadrático y la entropía cruzada de la red mostrada debajo usando Microsoft Excel. El nombre del archivo debe ser crossz.xlsx. |
| Problem 3 |
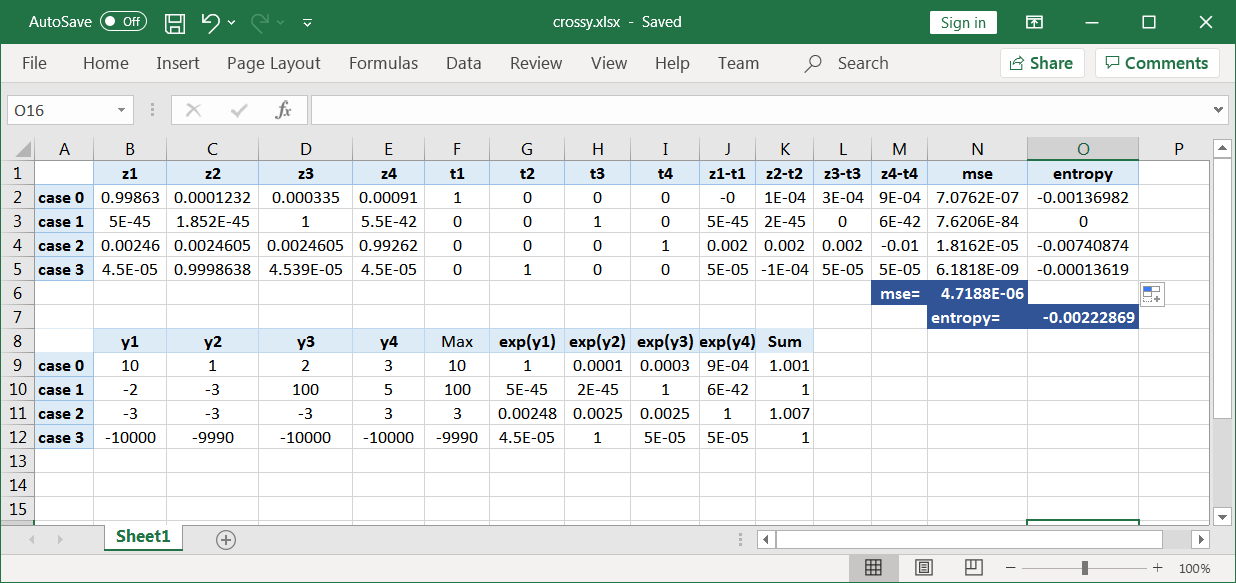
| Compute the mean squared error and the cross entropy of the network below using Microsoft Excel. The file name must be crossy.xlsx. Calcule el error medio cuadrático y la entropía cruzada de la red mostrada debajo usando Microsoft Excel. El nombre del archivo debe ser crossy.xlsx. |
| Problem 4 |
|
| Problem 5 |
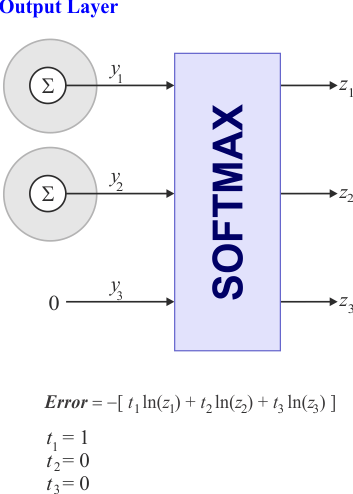
| Use your favorite program to create a 3D color graph for the Error as a function of y1 and y2 for the target values t1, t2 and t3. You can use: Matlab, Microsoft Mathematics, Algebrus, SciDAVis, GraphCalc, Veusz, MathGrapher, gnuplot, MathGV, GeoGebra, Functy. The graph below was generated using Wintempla and a "ColorMap" control, see Problem 2 in Wintempla > Graphics > Dynamic Bitmap . What value of 1 and y2 should be selected to reduce the error? Use su programa favorito para crear una gráfica 3D de color para el Error como una función de y1 y y2 para los valores deseados t1, t2 y t3. Usted puede usar: Matlab, Microsoft Mathematics, Algebrus, SciDAVis, GraphCalc, Veusz, MathGrapher, gnuplot, MathGV, GeoGebra, Functy. La gráfica de abajo fue generada usando Wintempla y un control de "ColorMap", vea el Problema 2 en Wintempla > Graphics > Dynamic Bitmap . Que valores de 1 y y2 deberían de seleccionar para reducir el error? |

| Problem 6 |
| Modify your code or program to plot the error for the values t1, t2 and t3 shown below. What value of y1 and y2Modifique su código o programa para graficar el error para los valores t1, t2 y t3> mostrados debajo. Que valores de y1 y y2 |

| Problem 7 |
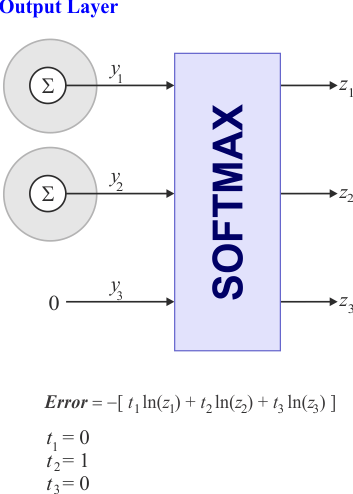
| Modify your code or program to plot the error for the values t1, t2 and t3 shown below. What value of y1 and y2Modifique su código o programa para graficar el error para los valores t1, t2 y t3 mostrados debajo. Que valores de y1 y y2 |
